Wheat Species and Their Market Significance
Wheat is one of the most important staple crops globally, and in the U.S., there are six classes of wheat, categorized by kernel hardness, color, and planting season:
Major Wheat Species
| Wheat Type |
Key Characteristics |
| Hard Red Winter (HRW) |
Bread flour, largest production & export (Great Plains) |
| Hard Red Spring (HRS) |
High-protein, premium pricing (Northern Plains) |
| Soft Red Winter (SRW) |
Used in pastries, most actively traded in U.S. Future market (Eastern U.S.) |
| Soft White (SW) |
Noodles & pastries, high exports (Asia) (Pacific Northwest) |
| Hard White (HW) |
Whole wheat products, small but growing demand (Limited production in KS, CO) |
| Durum |
Highest protein, used for pasta (ND, MT, AZ) |
To analyze the wheat future market, we will focus on the SRW wheat, since it is traded heavily on U.S. futures
markets, and is the second-largest wheat class.
The Soft Red Winter (SRW) Wheat
-
Primary Growing Regions: Eastern U.S., particularly in states such as: Ohio,
Illinois, Indiana, Missouri, Kentucky, Arkansas
-
Planting and Harvest Seasons: Typically planted in the fall (September to November), and harvested in early summer (June to
July).
-
Vulnerabilities: Early Spring Frosts, Excessive Rainfall and Drought.
SRW Wheat Futures Contract Specification
The SRW wheat futures contract is primarily traded on the Chicago Board of Trade (CBOT) and follows these
specifications:
- Contract Size: 5,000 bushels (136 metric tons)
- Price Quotation: Dollars per bushel
- Minimum Price Fluctuation: 1/4 cent per bushel ($12.50 per contract)
- Expiry Months: March, May, July, September, December
- Last Trading Day: the business day prior to the 15th day of the contract month
For a more detailed contract specification, see SRW WHEAT FUTURES - CONTRACT SPECS
Market Data Analysis
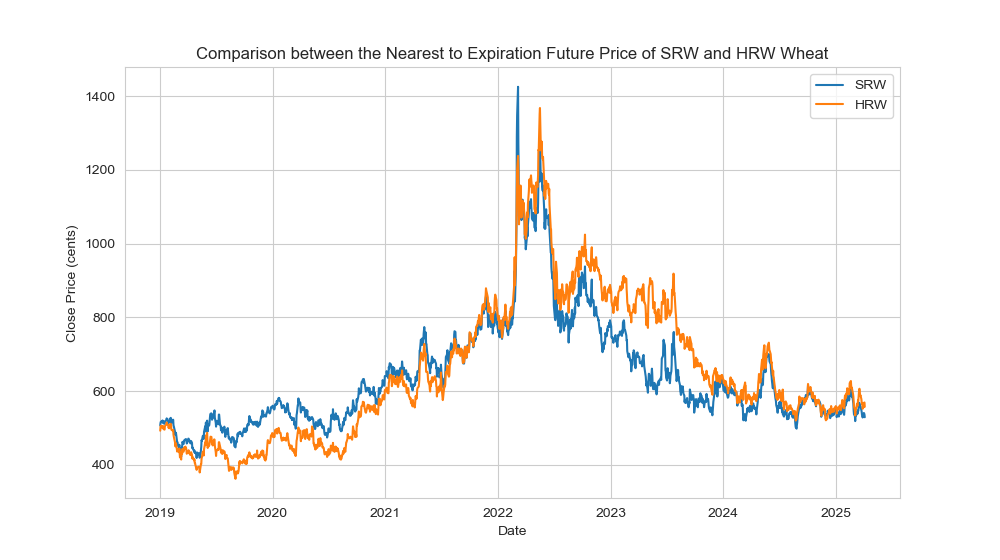
Wheat Futures Price Trends (Historical Perspective)
- SRW and HRW wheat futures exhibit similar price trends, indicating strong correlation in their market movements.
- A sharp price surge occurred in 2022, primarily driven by the Russia-Ukraine war, which disrupted global
wheat supply chains.
- Another significant spike in May 2024 resulted from a combination of frost damage in key European
wheat-producing regions and drought conditions across North America. For more details, see this
report
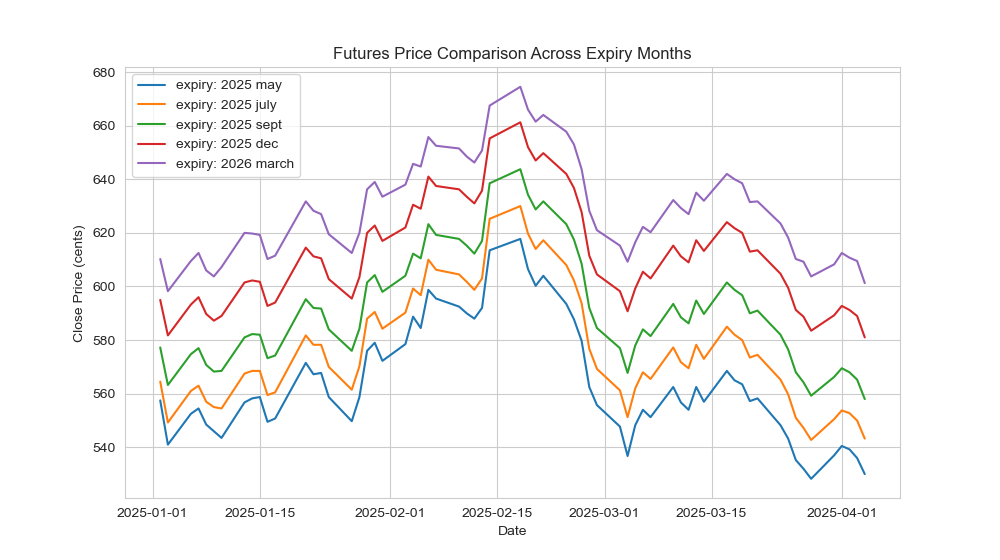
Contango Market Structure
- The futures contracts with later expiration dates trade at higher prices than near-term contracts. This is usually
called a contango market.
- Contango typically occurs due to the following factors:
- Storage Costs - Longer holding periods increase storage expenses.
- Financing Costs (Interest Rates)
- Insurance & Transportation Costs - Longer storage requires insurance against spoilage, theft, or contamination.
- Market Expectations - Anticipation of rising wheat prices can drive up futures prices for later contracts.
Trading Volume Analysis
- Seasonal patterns are evident in trading volume, reflecting recurring market behavior.
- Declining volume as expiry nears – Many traders reduce activity in expiring contracts, shifting focus to
later-dated futures instead of speculating on short-term price movements.
- Pre-expiry volume surge – As the expiry date approaches, traders must close positions to avoid physical delivery.
This leads to a temporary spike in trading volume before the last trading day.
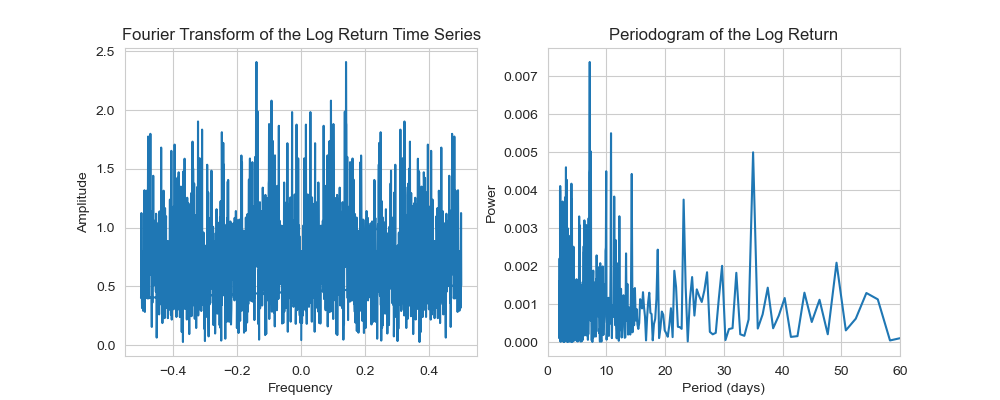
Spectral Analysis of Log Returns
- No clear seasonality – Fourier and periodogram analysis show no dominant cycles in the log returns of wheat
futures.
- Lack of sharp peaks – The periodogram exhibits no strong periodic components, suggesting price changes are not
driven by regular seasonal patterns.
- Market randomness confirmed – This supports the view that wheat futures prices are influenced more by
fundamentals than by predictable cycles.
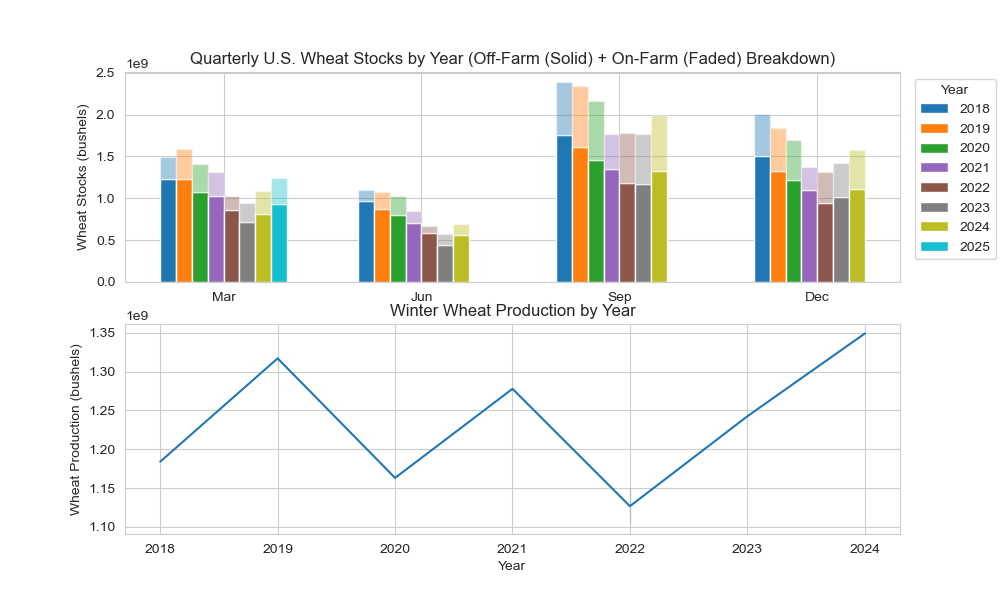
Supply and Demand Analysis
Wheat Production & Stocks
- Consistent drawdown (2018–2023) – Wheat stocks declined steadily across all four USDA reporting quarters (March,
June, September, December), reflecting tighter supply conditions and strong demand.
- Stock recovery begins in 2024 – Starting in 2024, wheat stocks began to rise, reversing a six-year downward
trend. By March 2025, wheat stocks reached their highest level in four years.
- Winter wheat production rebound – The recovery in stocks is supported by an increase in winter wheat production,
which began in 2024, driven by expanded planted acreage and improved yields. See this report.
Winter Wheat Production by Region
- Winter wheat concentrated in the Plains – Top producers include Kansas (22.8%), Washington (9.1%),
Oklahoma (8.0%), and Montana (6.8%), reflecting the dominance of winter wheat in the Central and Great Plains.
- SRW wheat centered in the Midwest and East – Leading states are Illinois (17.4%), Ohio (11.5%),
Missouri (10.4%), and Kentucky (8.5%), where SRW wheat thrives in more humid climates.
- Focus on key producers for modeling – We will use weather and crop condition data from these
major producing states to build our AI model.
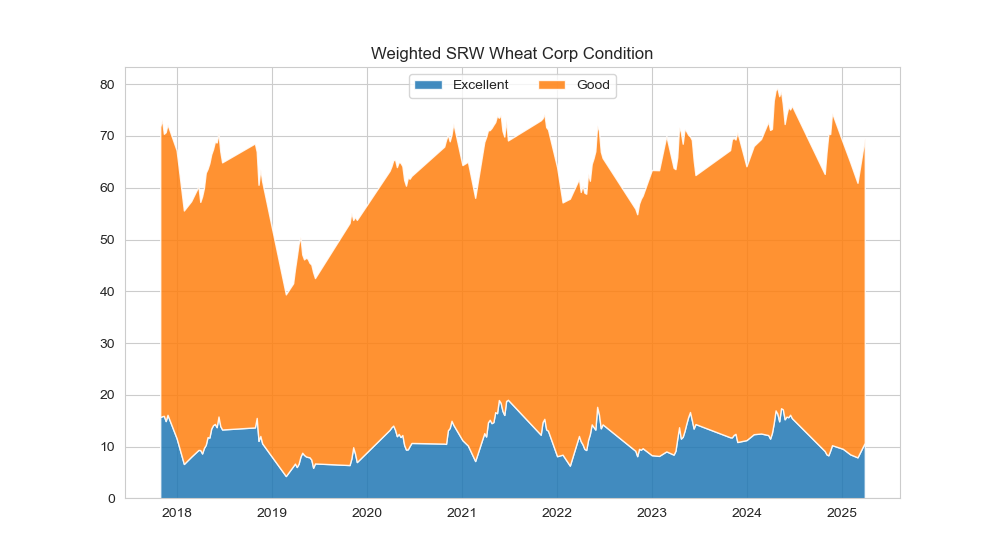
Weekly Wheat Crop Condition Analysis
- Crop condition weakly anticipates price movement – The weekly change in SRW wheat condition has a –0.05
correlation with next-day futures returns, which strengthens to –0.1 over the next 3 trading days, suggesting that price reacts gradually to crop condition updates.
- Negative correlation aligns with supply expectations – This inverse relationship makes intuitive sense:
improving crop health signals higher expected supply, which can put downward pressure on futures prices.