Fat-Tailed Distributions in Finance
In most classical financial models, we assume that asset prices follow a Geometric Brownian Motion (GBM). This implies that the log returns of the asset should be normally distributed.
However, empirical data shows that log returns often follow a fat-tailed (or heavy-tailed) distribution instead.
Comparison with the Normal Distribution
The tails of a standard normal distribution decay exponentially as:
\[\mathbb{P}(|X| > x) \sim \exp(-x^2).\]In contrast, the empirical distribution of log returns places significantly more probability mass in the tails. That is:
- Extreme events (both large gains and losses) occur more frequently than predicted by the normal distribution.
- This results in a distribution with higher kurtosis (peaked center and fat tails).
Evidence from Q–Q Plots
Here is the Q-Q plot against a normal distribution. We observe:
- Center of the plot follows the diagonal.
- Tails deviate sharply:
- Left tail bends downward → more extreme negative returns.
- Right tail bends upward → more extreme positive returns.
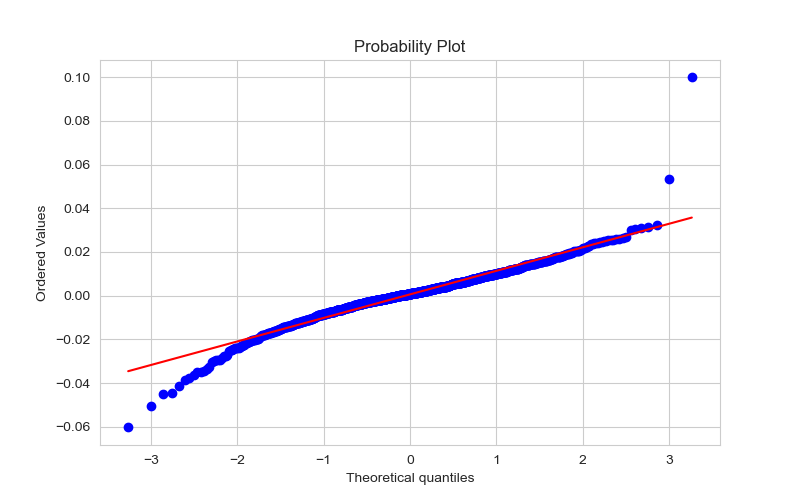
This characteristic “S-shape” or “bowtie shape” in the Q–Q plot is a signature of fat-tailed behavior.
Causes of Fat Tails in Financial Markets
Fat tails arise due to a variety of real-world factors not captured by simplistic models:
| Cause | Explanation |
|---|---|
| Information shocks | Sudden unexpected news (e.g., geopolitical events, economic reports) can cause large price movements. |
| Liquidity crises | In illiquid markets, large orders can have disproportionate price impact, amplifying tail risk. |
| Feedback loops | Mechanisms like margin calls or stop-loss cascades can cause rapid price swings. |
| Herding behavior | Investors may imitate each other, amplifying moves in one direction. |
| Volatility clustering | Periods of low volatility are often followed by high-volatility bursts, leading to heavy tails (often modeled via GARCH). |
| Leverage and derivatives | Use of leverage magnifies gains and losses, increasing tail risk. |